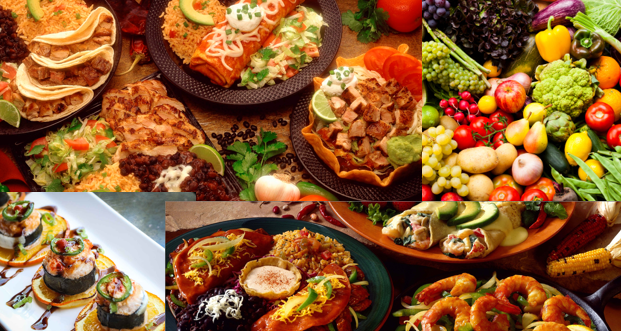
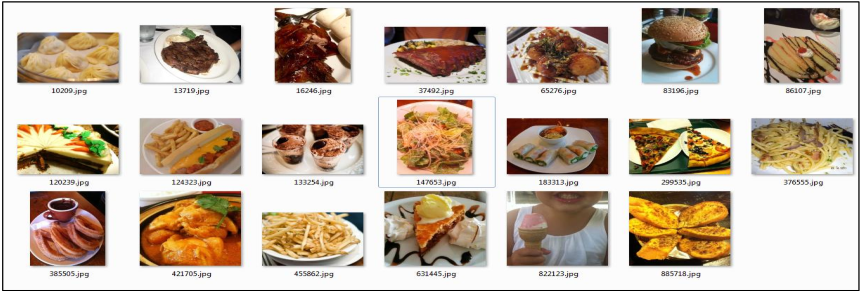
There is a recent public excitement over an algorithm that recognizes a person’s gender and age, so me and my classmate, Jay Garcia, decided to take this well-researched topic to everyone’s favorite activity, eating. In this post, I’m going to show you how we made an algorithm that can recognize some dishes AI-style. In particular, we’re going to see if a computer can classify images into apple pies, baby back ribs, Caesar salads, carrot cakes, chicken curry, chocolate mousse, churros, dumplings, French fries, garlic bread, hamburgers, hot dogs, ice cream, pancakes, peking duck, pizza, spaghetti carbonara, spring rolls, steaks and takoyaki. We have 150 images per dish for a grand total of 3000 images. That’s a lot of dishes that I wish I could feast on right now. Here’s what they look like.
The principle behind this classification task is finding traits of the image that makes it both representative of its dish and unique against the other dishes. For example, we want to capture the tender qualities of a steak since that’s very characteristic of any steak dish. At the same time, we won’t expect tenderness in Caesar salads. But what about baby back ribs? It’s also tender right? Well, this is the reason why we want a lot of these traits to make the algorithm’s task of working through the numbers easier.
Up to this point, I’ve been avoiding some technical terms, but we need some of them now. In machine learning, traits are called features while dishes are instances of classes. For other classification tasks, its classes depend on whatever we want to recognize, like gender or age brackets or sentiment.
So what could be the features of our images? Enter SIFT descriptors, which stands for Scale Invariant Feature Transform. It is a type of local feature which describes small interesting regions in an image. Developed way back in 1999, these feature descriptors are still popular today. See the little circles in the steaks at the bottom? These are the detected interesting regions of the image. We used OpenCV to easily get SIFT descriptors for all of our dishes. Beneath the hood though, SIFT is actually a beast of an algorithm, using Gaussians and Hough transforms. At the present, library methods is enough for me.

What’s next? We then quantize our feature descriptors, or turn them into values our algorithms can understand. Simply put, it’s like putting the features to a spreadsheet. It turns out, we’ll use some inspiration from the natural language processing community and produce bag of words. Bag of words is a representation that quantizes feature descriptors into a visual images vocabulary. Remember when you were young, you were developing a vocabulary of words by hearing new words being used in everyday speech. If we take this to images, then our new words are our SIFT feature descriptors that describe some small part of the image. Taken together, we can describe our carbonara. Do this for the entire dataset and we can have that spreadsheet we’ve talked about.

I skipped over some details like how exactly does quantization happen, or what is the code book’s representation (hint: K-Means and cluster centroids, respectively). However, I hope the present material is enough to whet our appetites. For this project, we have a thousand visual word vocabulary which is the same as saying we can recognize a thousand English words. We then go to the actual classification. Now that we have our dataset in numeric form a la spreadsheet, we then determine the machine learning algorithm to use. Machine learning is replete with algorithms that can distinguish the optimal decision boundaries in a dataset. Take for example the representation below of red and green circles. The dataset is 2D for easy visualization. Classification is the task that finds the optimal decision boundaries between classes such that there’s minimum errors for the user requirement. For our problem, we have a thousand dimensions, and 20 classes, so obviously that’s not very straightforward. For this project, we used K-NN, which is simply finding some K nearest samples and classifying based on their classes. It’s the machine learning world’s equivalent to the proverbial saying, birds of the same feather flock together –given of course the numbers add up nicely. There are more algorithms, which I hope to share with you the next time.

With the present methodology, we achieved our best result of 30.6% which is not bad, considering our simple classification strategy. We’re actually some 25% above random guessing, so hurray! It seems our classifier is getting work done! At the present, it’s really good in recognizing dumplings, French fries and spaghetti carbonara. On the other hand, it’s mixing up steaks with ribs and peking ducks since they all look tender and meaty. It’s also having trouble with Caesar salad and takoyaki since some of the latter’s images contain a large amount of vegetable garnish. It turns out that explaining these errors are not only necessary for determining the next step for improvements, but it can be fun as well, since the algorithm may notice things beyond our normal expectations. For a full discussion, please view our paper and our GitHub site, which are linked below.
https://github.com/krsnewwave/CS282-Mini-Project
All this is thanks to Jay Garcia, the wonderful people taking care of OpenCV and our professor in machine learning and computer vision Pros Naval. Lastly, our references can be seen below. Yes, actual data scientists are looking at this challenge very seriously. After all, food is always to be taken seriously.
[1] L. Bossard, M. Guillaumin and L. Van Gool, “Food-101 –Mining Discriminative Components with Random Forests,” in European Conference on Computer Vision, 2014.
[2] M. Chen, K. Dhingra, W. Wu, L. Yang, R. Sukthankar and J. Yang, “PFID: pittsburgh fast-food image dataset,” in 16th IEEE
international conference on Image processing (ICIP’09), Piscataway, NJ, USA, 2009.
[3] G. M. Farinella, D. Allegra and F. Stanco, “A Benchmark Dataset to Study the Representation of Food Images,” in International Workshop on Assistive Computer Vision and Robotics, 2015.
[4] U. Avni, H. Greenspan, E. Konen, M. Sharon and J. & Goldberger, “X-ray categorization and retrieval on the organ and
pathology level, using patch-based visual words,” in Medical Imaging, IEEE Transactions on, 30(3), 2011.
[5] G. M. Farinella, M. Moltisanti and S. Battiato, “Classifying food images represented as Bag of Textons,” in 2014 IEEE
International Conference on Image Processing, Paris, 2014.
[6] Yu, J., Qin, Z., Wan, T., & Zhang, X. (2013). Feature integration analysis of bag-of-features model for image retrieval. Neurocomputing, 120, 355-364.
