The SYKES ADMU Data Science Hackathon 2nd Edition concluded last February 1-2 in the Rizal Library. This year, we invited more than ADMU students . We reached out to our networks in UP Diliman Department of Computer Science and others. As a result, the teams were a mix of competitors from both schools. Cool.
As game master of this event, I had the privilege of creating and running the Kaggle competition which will be the problem set of the students. A leader board would pit the students’ solutions against one another and when the time ticks out (tomorrow), it was data story-telling time. It was a combination of machine learning chops and business-domain know-how. I set the task to be: Predicting which customers would redeem coupons under specific campaigns. This is important in e-commerce since marketing efforts can be reinvigorated for customer segments using specific campaign methods and coupon promotions. The three IDs, our customers, coupons and campaigns form our triplets. This post will be about my solution.
As always, here’s the Github link if you just want to skip over to my solution. Let’s begin!
The Data and Beginning Thoughts
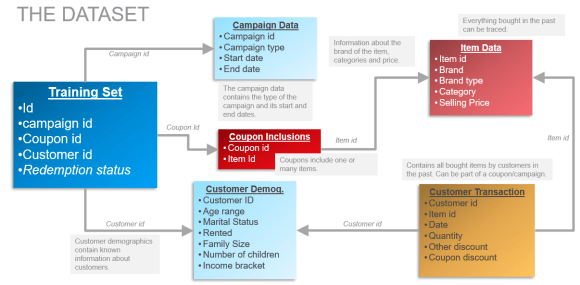
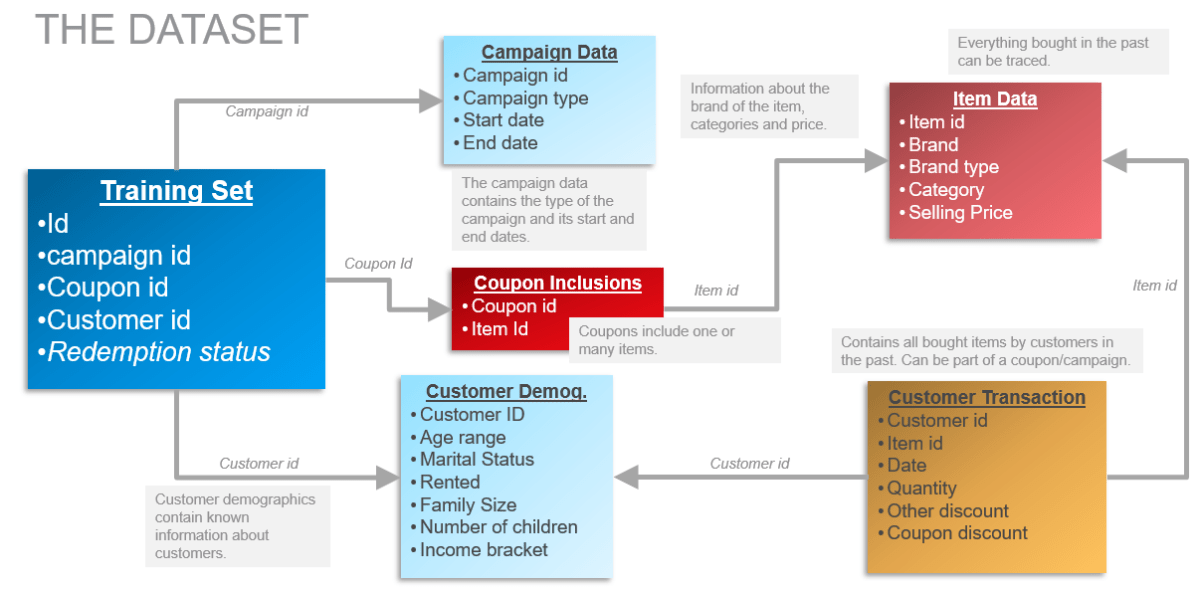
The dataset contains item transactions by all customers whether or not a coupon has been redeemed. Exciting, so I can do a recommendation engine. However, I was beginning to see that this ongoing thing I have for recommendation is like applying a hammer to every nail. Hence, let us see this from the angle of feature engineering. We should create a nuanced understanding of how the data behaves from several angles. On to some exploration!
Exploratory Data Analysis
A small number of coupons dominated this data, as is the norm in many e-commerce applications. Only 5 coupons have been redeemed more than 50% of the time, out of more than 200 coupons. As game master, I have created the ‘popular coupons only’ as the baseline non-ML solution. Just labelling the top 10 coupons as ‘always redeemed’ nets the participants 0.87 AUC. However, there is a glaring sampling issue here. If a new coupon is found which was not in the training data, then we’re absolutely stumped. In the real-world, executives expect something new — they won’t likely be bought by a presentation containing the same old promoted coupons! ‘Give me something new’ is what many professionals dread…
I wanted to find features that are generalizable. I want to put in features that are characteristics of the coupons, like the campaigns, customers, transactions and the items. For example, here are some interesting things:
Discount and selling price compared between classes
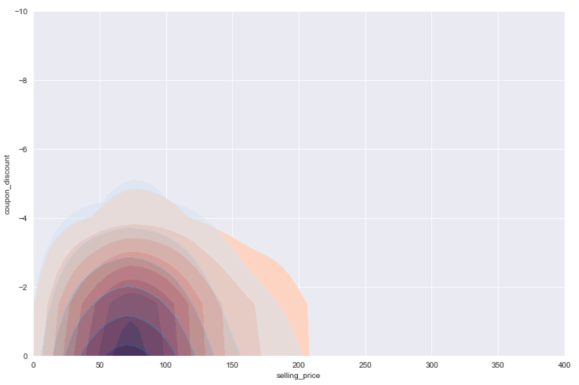
The discount and the selling price itself matters of course. What makes this hard for straightforward analysis is that a coupon is applicable to several items. So I don’t know, from this graph, the redeemed and non-redeemed triplets do not look distinguishable. The oranges are the redeemed triplets while the purples (blues and reds mixed in the same space) are in the middle. There is a statistical difference for the average discount and minimum discount however. The minimum discount is higher on the redeemed triplets since it’s a low baseline to get. Lower discount, yeah! Non-intuitively, the average discount is slightly higher on the non-redeemed triplets, probably because some customers find some items within it intimidating.
Redeemed coupons per income bracket
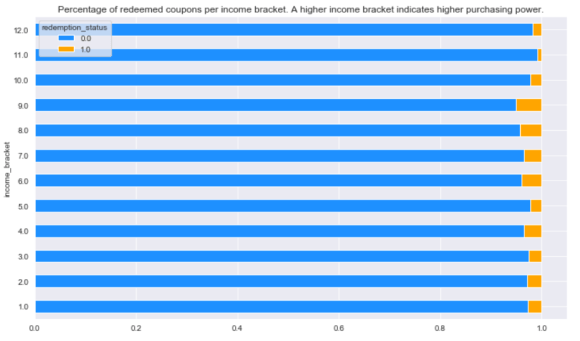
Here’s a simple one. A higher income bracket indicate a higher propensity to redeem coupons for our triplets. However, the highest two brackets seem to be the least interested. Coupons? How plebeian!
Brands and Categories Redemption Percentage
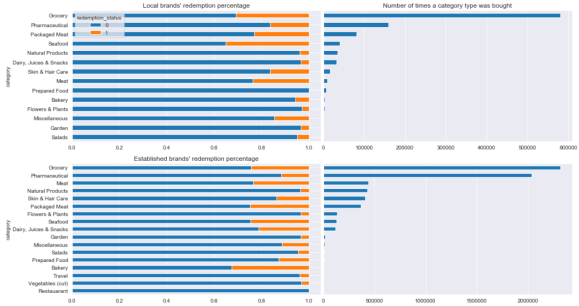
When we turn to categories and brands, we see for both local and established brands, groceries and pharmaceuticals are top dogs. For local brands, customers look for packaged meats and seafood since the former is accessible while the latter may be fresher than imports. The established brands, nearly everything depends on groceries and pharmaceuticals, with these two accounting more for everything else in the item groups combined.
We zoom in on established brands. If a coupon contains an established brand, and the customer has bought an established brand before, then that’s a match made in heaven. Added bonus if it’s groceries / pharmaceuticals. It’s rather hard to visualize, but the principle should be there.
Conclusion: A non-linear model would work best. With our findings on the category and brand type, both the customer and the item should have an appetite for the same thing.
Modelling Run
Not focusing too much on running the models of course, since they should be straightforward. The only wise thing to remember is that since this a very skewed dataset, then the class weights or the loss functions, metrics and training methods should account for this skew.
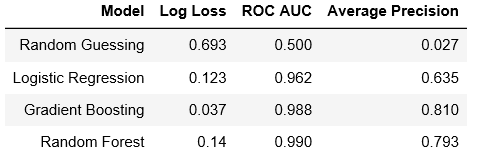
- I skipped hyper parameter optimization for speed.
- Also, in our tests, the ratio of negative to positive samples are very very skewed (15009 negative – 423 positive examples).
Logistic Regression Coefficients
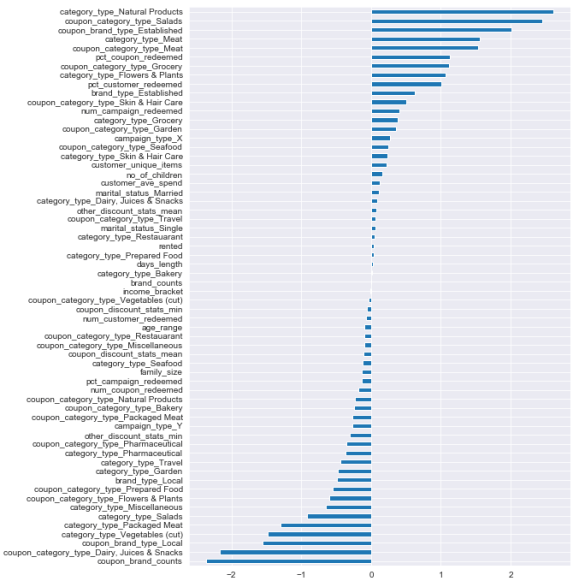
Here’s the coefficients of the linear classifier. It was limited on the achievable separating hyperplanes of the data, which is why it focuses on natural products, salads, established brands, dairy, etc, individually.
Random Forest Feature Importances
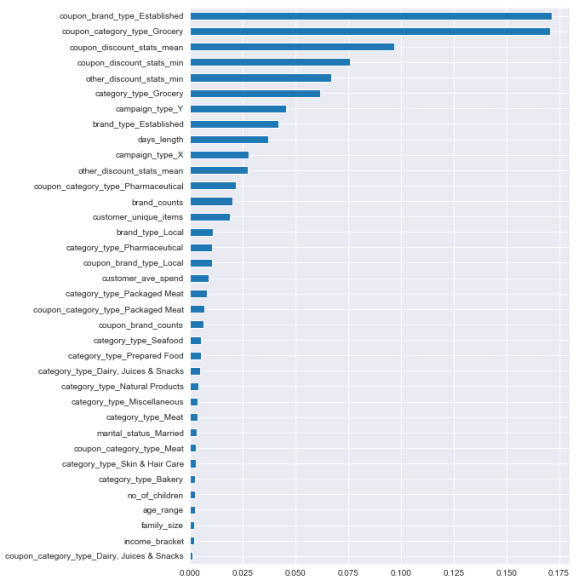
The non-linear ensemble models however were king. Here we see the feature importances of the random forest classifier. We see in the top features our expected coupon_category_type_Grocery (the number of grocery items applicable in a coupon) and the category_type_Grocery (the number of grocery items a customer has bought in the past). There is an between coupon, category features and a bunch of other things we haven’t discovered in EDA like campaign types and number of brands contained in a coupon.
Concluding Words
There are further things to be done in this area. PCA to compress the user-item matrix should work well. Consequently, this is the road to recommendation engines, so might as well mention that again too. Recommending items to users is one thing, so we recommend the coupon that has the max discount for that item is a good idea.
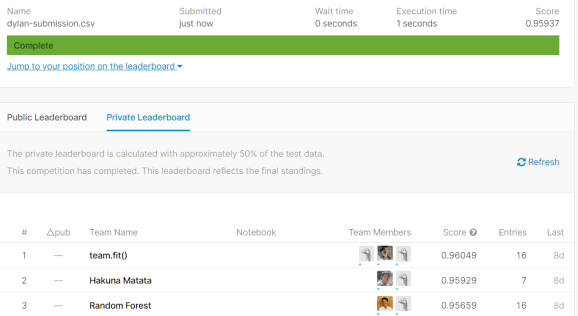
If you have reached this far, I want to give a shout out to the winners. That’s Hakuna Matata, Random Forest and Team.Fit(). I should say that my own solution was surpassed in the private leaderboards by Team.Fit() in terms of AUC. GGWP. See you soon around the data science community!
Credits to the original dataset which I found in Kaggle. I have taken created pseudolabels to the test set to expand the training set when I saw the dearth of positive examples. These pseudolabels are from the 90th percentile of the probabilities of a hyperparameter-optimized random forest model.

One reply on “Coupon Redemption Competition”
[…] published at https://itstherealdyl.wordpress.com on February […]
LikeLike